Dipping into the rich jar - How much money could the UK raise from wealth taxes?
We tax work heavily in the UK—but barely tax wealth. Should that change? This paper asks a simple question: how much could a wealth tax actually raise? The answer may surprise you.
By Prashant Vaze[1]
After years of stagnating at the UK political fringe, taxes on wealth are being debated in the UK, perhaps prompted by Rachel Reeves’ high-value council tax surcharge announcement, Zack Polanski’s popularity[2] and the UK’s fiscal policy incoherence[3]. Wealth is much more unequally distributed than income. Rather than a unified wealth tax, we have a medley of taxes on assets: Council tax on homes, Inheritance Tax (IHT), capital gains tax (CGT) and stamp duty on share and property transactions.
The distribution of wealth is correlated but different to the distribution of income, and is concentrated in the hands of older people, while income is somewhat concentrated in middle-aged people. Taxing wealth more systematically offers the potential to substantially increase the amount of revenue currently raised, address inequality and redress un-affordability of housing by encouraging downsizing. Taxing wealth raises questions about intergenerational fairness, practicality and unpopularity with the losers from the changes.
Wealth inequality in the UK
The distribution of wealth is highly skewed. Figure 1 shows the asset ownership by UK households ranked by wealth into deciles[4] drawn from the government’s wealth and asset survey (WAS). The poorest decile (the bottom of the table) owned £8,700, the richest decile owned 180 times more, and the richest 1%, 400 times more. Even so, the richest 1% (269,000 households) total assets - at £3.6 million – are well below the Green Party’s threshold (see footnote 1). Skewness in wealth increased in the 1990s and 2000s, but this skewness has not changed markedly over the last few WAS surveys.
Figure 1: Total and components of wealth.
Individual Household wealth by components (£000) | Total UK wealth | |||||
Wealth slab | Net Financial | Physical | Net Property | Private Pension | TOTAL | (£bn) |
Top 1% | 640 | 206 | 1400 | 1381 | 3626 | 979 |
Deciles | ||||||
10 | 218 | 123 | 624 | 626 | 1591 | 4,294 |
9 | 86 | 82 | 380 | 344 | 892 | 2,407 |
8 | 47 | 68 | 280 | 216 | 611 | 1,649 |
7 | 29 | 57 | 230 | 140 | 456 | 1,232 |
6 | 16 | 49 | 162 | 98 | 325 | 877 |
5 | 8 | 41 | 95 | 73 | 217 | 585 |
4 | 4 | 35 | 50 | 45 | 134 | 361 |
3 | 1 | 29 | 0 | 29 | 59 | 159 |
2 | 1.1 | 19.7 | 0.0 | 2.5 | 23.3 | 63 |
1 | 0.0 | 8.7 | 0.0 | 0.0 | 8.7 | 23 |
Mean/Total | 41 | 51 | 182 | 157 | 432 | 11,650 |
Source: ONS Wealth and Assets Survey, Rows (except first) represent deciles of UK households ranked by falling wealth. Each decile is 2.7 million household
Another £1.6 trillion of defined benefit pension assets belong to public sector employees but are excluded from the ONS survey. The WAS excludes employer-provided pensions due to 8.1 current or former public servant employees. These comprise the pay-as-you-go defined pensions received by civil servants, NHS staff, armed forces and teachers and the funded local government schemes.[5] These have total liabilities of around £1.6 trillion of which £1.3 trillion is unfunded and £0.3 trillion funded. This should be added to the overall value of household wealth. This £1.3 trillion is visible to the beneficiary and the tax authorities through the annual benefits statement, which imputes a value for the pension pot. There is no data available to allocate this pension between different deciles of income, but I assume the top two deciles of wealth own 61.7% (£1 tr) of the defined benefit pension pot in line with private pensions e.g. pensions due to doctors, senior civil servants, judges etc.
Data within the top 1% very wealthiest households is not available from WAS. Instead, their wealth can be glimpsed from the HMRC inheritance tax data[6] and The Sunday Times’ Rich List. Both data sets have their flaws. Wealthy people exploit numerous loopholes to reduce liability to inheritance tax. The HMRC data, therefore, understates the number of extremely wealthy. In 2022-23, 202 people died in the UK with estates greater than £10 million, out of some 600,000 annual deaths, and their average estate was £21m. By way of comparison, 1640 died with assets of more than £3 million. The author by integrating HMRC and ONS data and calculates 41,000 people (0.15% of UK population), have fortunes greater than £10 million with a combined wealth of £892bn.
UK estates that notified HMRC with inheritance tax returns (IHT) in 2022-23
Net value of estate - £ (lower limits) | Number taxed | Mean net value of estate (£) | Total UK value estates (£m) |
1,000,000 | 7,890 | 1,275,000 | 1,543 |
1,500,000 | 2,780 | 1,694,737 | 1,515 |
2,000,000 | 1,980 | 2,439,130 | 2,707 |
3,000,000 | 671 | 3,357,692 | 1,968 |
4,000,000 | 340 | 4,521,739 | 1,592 |
5,000,000 | 307 | 6,000,000 | 2,550 |
7,500,000 | 120 | 8,350,000 | 1,678 |
>10,000,000 | 202 | 21,352,941 | 15,673 |
Source: HMRC: table excludes estates smaller than £1m that notified HMRC, since many families utilise spousal transfers and reliefs on residence to shield the first £1million of net value
HMRC IHT data is highly skewed toward older people. Only 3.5% of deaths recorded in UK are of people below 45 years old, and 70% of deaths are of individuals aged above 74.
The 2025 edition of the Sunday Times’ Rich List lists the UK’s 350 richest people/families (coincidentally cuts off at £350 million). Of the top ten on the Rich List, just two were born in the UK, three in India and others in Ukraine, Israel, Australia, Norway and Russia. In other words, a huge proportion of the wealth is concentrated in a handful of globally footloose people. Most of the assets owned by these individuals are unconnected with the UK, and at least one of the ten is moving following changes to the UK’s non-dom regime. The Rich List identifies 156 billionaires with a combined wealth of £655bn. Though the Rich List data and government data are not strictly comparable, taken at face value, these 156 billionaires own around 80% of the wealth of the richest 1% of the UK. Glaring inequality is evident even in the Rich List. The 175 poor souls in the Rich List’s bottom half (including relative paupers like Elton John and the Duke of Bedford) collectively own just 16% of the assets identified by the Rich List.
Table 2: Sunday Times Rich List, wealth of the richest 350 UK individuals/ families
Band | Value Assets (£ tril) | Count |
>£10bn | 240 | 13 |
£5bn to £10bn | 187 | 26 |
£2bn to £5bn | 125 | 44 |
£1bn to £2bn | 103 | 73 |
£0.9bn to £1bn | 23 | 24 |
£0.8bn to £0.9bn | 18 | 21 |
£0.7bn to £0.8bn | 18 | 24 |
£0.6bn to £0.7bn | 16 | 25 |
£0.5bn to £0.6bn | 15 | 27 |
£0.4bn to £0.5bn | 18 | 40 |
£0.35bn to £0.4bn | 13 | 34 |
Total | 773 | 351 |
Source: author’s calculations from the 2025 Rich List
Who should be taxed?
Trying to tax only the very richest people living in the UK impacts a tiny proportion of people. Taxing the wealthiest (those with assets > £10m, or >£1bn) runs the risk of low tax yields, not because these people are not immensely wealthy; they are. But this wealth is hyper-concentrated in a few hundred people who are notoriously reluctant to pay, and easily able to leavethe UK. A laser focus on this cohort, without a high degree of international coordination, invites this wealth to simply relocate to a more tax-benign (and likely warmer) environment. Though not all highly wealthy people will relocate to evade taxes, bound by other ties.
A different strategy is to tax the mass-rich, whose wealth is more captive held in property and tax-advantaged pensions. The assets owned by the wealthiest 10% of the UK population – 2.6 million households – is £4.3 trillion, 6.5 times greater than the assets owned by UK billionaires; the wealthiest 20% own £6.7 trillion.
What assets should be taxed?
Rich households own different types of assets to the poor. Figure 1 and Table 1 show that the poorest decile’s wealth consists solely of physical goods like vehicles and furniture. They have no savings or equity in their homes. As wealth increases, financial savings products (shown in orange) become more important. These comprise Pensions, which can be seen as a form of tax-sheltered, deferred financial savings, and Savings products like shares, ISAs and bank deposits, less any loans. The rich prefer saving via pensions because of the tax advantages, and because they can afford to defer consumption until they reach retirement age.
Figure 1 Composition of wealth by asset class
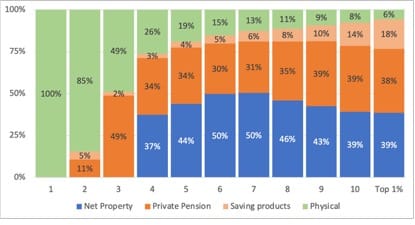
Source: WAS
To encourage people to save for their retirement successive governments have introduced generous subsidies, but these have been largely pocketed by the already rich, exacerbating wealth inequality. These currently comprise:
a) Contributions not subject to income tax: for a 40% taxpayer, every £1 contributed costs £0.60.
b) there are no taxes on capital gains or dividends in the underlying securities
c) at retirement 25% of the lump sum can be taken out tax free (up to £268k) and
d) the remainder can be dribbled out slowly at a rate to minimise the income tax.
Calculations by the author suggest a 20% taxpayer will see a 3.8 fold growth in their pension pot compared to their present consumption sacrificed, a 40% pax-payer a five-fold growth and a 45% tax-payer a 5.5 fold growth assuming 5% real growth over 40 years.
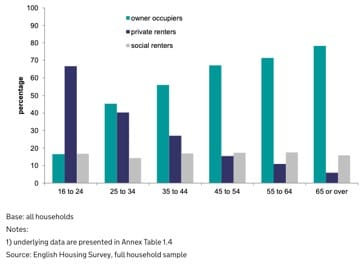
The largest asset class is ‘net property’ which accounts for 42% of all wealth. Only the richest 70% own homes. The term ‘net’ in this context is important. Of the stock of homes, 8.8 million own their homes outright, 7.3 million have mortgages and a further 8.8 million live in rented accommodation. Altogether mortgage holders have £1.7 tr of outstanding mortgages[7] representing around a quarter of the gross value of residential housing. Over a third of households, pay around a third of their income to rent while the remaining two-thirds live in an appreciating asset. Property ownership has been an engine of inequality.
Poorer, younger households own property too, but usually with sizeable mortgages and usually purchase their first home at an older age than their parents. This is shown in Figure 2. Of the people that own a home, the vast majority (94%) of over-65-year-olds own their home outright, while only 19% of under 54-year-olds can say the same. Despite the high cost of renting, many younger people delay the purchase of their first home in order to save enough to pay a deposit of 10% or more.
Figure 2: Housing tenure by age of the head of household
Assets vary in how easily they can be taxed. To tax an asset, it must be defined as within scope, detected, valued, and, if the owner does not have alternate means of raising cash, be sufficiently liquid to generate cash to pay wealth tax. All these steps can be contentious. Here are the questions that need to be considered:
· Should a UK’s taxpayer’s overseas home / bank deposits be in scope?
· How to detect valuable belongings like jewellery, antiques or paintings?
· How to value unique items like artwork, or rarely traded assets like homes?
· Should an asset be valued on its full market value, or its net value subtracting any loans?
· How should asset-rich and cash-poor households pay asset taxes when they have little income?
Assets such as shares in listed companies are easy to value, easily sold and the wealth relocated and managed from overseas. If the tax were applied to worldwide assets owned by UK tax-residents it would require co-operation with foreign tax-authorities, not all of which have signed double taxation treaties with the UK. Valuables e.g. jewellery, vehicles and artwork could in theory be taxed on the basis or their insured value or deemed out-of-scope given their low aggregate value.
Pragmatically, it might be easiest to tax the gross value of residential property and private pensions since a) these two assets account for around 80% of wealth, b) good administrative data is available for property ownership and the value of private pensions. Asset rich, cash poor people might be provided the option to roll-over their liability until the asset is sold.
A tax on the top 20% wealthiest households on their private pensions and gross value of property would yield £62bn / year per 1% wealth tax.
A market value-based property tax, like the proposed mansion tax, has a very different impact to a net property wealth. The former has a huge impact on the younger, first-time homeowners with high loan-to-value mortgages where the costs of tax are imposed on top of the mortgage repayments. A property wealth tax has a huge impact of the asset rich, cash poor (often older) households. If one of the purposes of the tax is to deflate the housing bubble, cash-poor asset-rich households, e.g. empty-nesters, could be helped to down-size into smaller homes. It is also worth considering reducing or repealing property stamp duty as this deters purchase of property.
Intergenerational issues and a wealth tax
The distribution of wealth with age and income with age is markedly different. Whereas old people are far wealthier than young people, middle-age people earn somewhat more than young and old. Figure 3 shows the 55–64-year-olds are the richest cohort with a median wealth of £500-£1 million. Income peaks in the 45-49 age band with a median income of £33,600 and a mean income of £51,600. Just 6% of 25-34-year-olds are millionaires, compared to 29% of 55-64-year-olds! Pensioners (above the age of 65) are the second wealthiest cohort, with high levels of home ownership and private, sometimes defined-benefit pensions (excluded from the data).
Figure 3: Wealth of households led by different ages
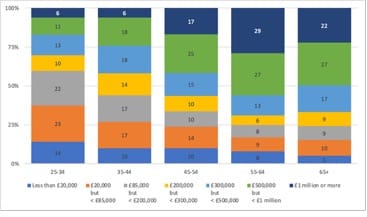
Source: ONS, Wealth and Asset Survey, sample 2020-2022
A wealth tax aimed at the richest two deciles with assets, proposed earlier (i.e. with assets more than £900,000), shifts the burden of taxes to the above-55s and away from the middle-aged.
Income distribution is an order of magnitude more egalitarian than the wealth distribution. The difference between the earnings of the highest and lowest fifth of households is 11.6-fold (£114,323 for the highest earnings fifth compared to £9,834 for the lowest earnings fifth) before tax. After redistributive taxes and welfare payments, this reduces to a 3.4-fold difference (£82,000 and £24.500).[8] In the absence of significant existing wealth taxes (discussed in the next section), inequality in wealth remains entrenched and spans generations, barely scratched by a widely evaded inheritance tax.
Existing taxes on wealth and concerns about wealth taxes
Some assets are already taxed. Tax is sometimes paid when ownership is being transferred, when the market price can be assessed. In the absence of a market price, the tax rate might be set on a scale that is weakly linked to value (Council Tax), or at a flat rate (Vehicle Excise Duty, after the first year). This tactic of taxing transactions or using scales avoids imputing prices, which can be controversial and open to manipulation (deliberate understating of asset values to reduce tax liability).
The list of existing asset taxes and their yield is drawn from HMRC data for the financial year 2024-25, unless otherwise specified.
· Council Tax: Annual tax paid by tenants and owner-occupiers. The average bill per property is £2,280 and is levied at between two-thirds (Band A) and twice (Band H) the Band D level in England, making it mildly related to the price of the property. There are various discounts available. Local government collected £41.2 bn from residential council tax.
· Stamp Duty Land Tax It is levied at slabs which increase from 0% (first £125,000) to 12% (value above £1.5 million) on land and buildings when ownership is transferred. Owners of more than one home pay an additional 5%. The tax yielded £13.9bn.
· Capital gains tax paid on the appreciation of assets like buildings (except primary residence), shares and bonds yielded £13.7 bn.
· Inheritance Tax: paid by all estates (except transfers between spouses). This is nominally set at 40% of the taxable value of the estate but allowances and exemptions meant just £6.9 billion was collected from £62.7 bn of net declared value of estates in 2022-23. In 2024-25, inheritance tax yielded £8.2 bn.
· Vehicle Excise Duty: Annual tax levied by DVLA at £195/year from second year plus a supplement of for cars with a list price of £40,000 or more. It is arguably less a tax on wealth and more a tax on the externalities caused by driving. On the year of first registration the rate varies between £10 and £5490 depending on carbon emissions. Yield of £8.2 billion.
· Stamp duty shares: This is paid on the value of UK shares purchased in companies that are incorporated in the UK. It is levied at 0.5% of the value of purchases and yielded £4.3 bn.
The listed asset taxes raised £89.54 bn in 2024-25. These taxes cause significant unintended distortions. High rates of transaction taxes inhibit transactions, e.g. Stamp Duty Land tax, impeding people moving home for work or changes in family size. Discounts in council tax are applied for single occupancy, empty property (for certain uses), when one might argue these should attract surcharges, given the shortage of affordable homes in many attractive locations. Stamp duty on shares is only paid on UK-incorporated or registered companies, but not on shares traded in other exchanges or purchases of corporate or government bonds, encouraging saving through these other instruments. By way of comparison, income tax raised £302 billion and national insurance £168 billion in 2024-25, five times more.
There are also implied subsidies through exempting some assets from the above taxes. Most glaringly, the sale of the primary residence is exempt from capital gains tax, savings in private pension and ISAs are exempt from capital gains and income tax. These policies are intended to encourage home ownership and saving for retirement, but have the effect of shielding income and capital gains for those in society who own homes and private pensions, which, as we saw already, is concentrated in the upper deciles of wealth. The Taxing Wealth Report, 2024[9] addresses the possible revenue effects of removing these subsidies, some of which are reproduced below. The paper also makes many other suggestions for tax reforms to NI and income tax, which this author supports but which are outside the scope of this paper
Change in pension / housing tax | Annual yield (bn) |
Restricting pension tax relief to the basic rate of income tax | 14.5 |
Aligning capital gains tax and income tax rates in the UK | 12.0 |
Charging capital gains tax on the final disposal of a person’s main residence | 10 |
Source: Taxing Wealth Report, 2024
Objections to wealth tax Three substantive objections to wealth taxes are they are unfair, that they hamper family-owned businesses and rich people will relocate to other countries to avoid UK wealth taxes. There are also many objections such as the difficulty of assessing wealth and the size and power of the tax avoidance industry which is deeply opposed to change.
Unfairness of wealth taxes By ‘unfair’ people often mean that after having been taxed when they earned their money, their prudence in building up a nest egg is now being subjected to a recurring tax. That’s not what they signed up! A counterpoint is that the incredible appreciation in asset prices enjoyed by Baby Boomers and Gen X was a one-off, and the once-in-a-century windfall they bagged denies Millennials and Gen Z equivalent opportunities (or at least until their parents die).
Subjecting family-owned businesses to inheritance taxes exposes them to a tax that other corporate forms don’t face. Payment of IHT for a typical SME (such as a farm or retail unit) will require the business or its assets to be sold to pay IHT at 40% (less allowances). The same is true of other family-owned businesses (a point James Dyson makes about his own rather large family-owned business). It is for this reason that farms are already partly exempt from inheritance tax.
Rich people and their money are highly mobile Design of the wealth tax needs to think through the globalisation of the UK economy. Rich people are not short of countries that will welcome them with fawning tax privileges (though there is more to life and domicile than tax avoidance). We must recognise the existence of international tax havens, strategic tax decisions taken by other countries’ tax authorities, and the interaction between personal and corporate taxes, especially for assets used for both private and business purposes, e.g., vehicles and property. As has been documented in the press Lakshmi Mittal (worth £15.4 billion according to The Sunday Times) moved his tax residency from UK to Dubai to avoid inheritance tax following the repeal of non-dom tax rules.
Recommendations
There are two broad approaches to the design of a UK wealth tax. A purist approach would be to apply an annual wealth tax across all an individual’s assets above a certain level of wealth either at a single rate, or at an escalating rate at higher slabs of wealth. This is a flagship policy advocated by the Green Party[10]. The alternative approach would be to adapt the existing taxes on assets (council tax, IHT, stamp duty and CGT) and remove subsidies that shield wealth from taxes (CGT exemption on owner occupation, ISA and pension tax reliefs) introducing tax where there is no existing regime to adjust.
This note advocates the latter approach. It proposes a quite dramatic change to the current regime to significantly increase the fiscal space for green and social objectives.
It is worth reiterating that the purpose of proposed wealth tax is to raise revenue (significantly more than the £89.4 billion current haul from the myriad taxes), reduce wealth inequality and encourage the sale of underutilised assets (warehousing or art and delaying down-sizing homes). Homes are the biggest store of wealth and the most rival of assets where misallocation between households deprives young families of space and supplies empty nesters with homes which they cannot maintain as their health declines.
Property: The suggestion here is to replace the Council tax and stamp duty and IHT on property with a tax on gross property value, or the underlying land to avoid discouraging investment in building improvements (land value tax), that ranges from 0.5% on the first £250k, 1% on the next, 1.5% for the next £500k and to 2% on the slab above £1m, and to charge capital gains on the disposal of the primary residence, with discounts if the proceeds are spent on downsizing to encourage empty nestors to vacate depreciating expensive homes. The transfer of the house upon death (except to the spouse) will attract capital gains tax based on the value it was purchased at, at a flat rate of capital 18% or 24%, depending on whether the recipient is a lower or higher rate taxpayer. This avoids incentivising empty nesters to hold onto properties. The Council tax is the largest existing tax that would be replaced: the current average rate of £2280/year is around 0.76% of the average house price of £300,000, but exemptions and discounts already shield lower-earning households. Together, these changes will substantially increase the tax paid on valuable homes and hit asset-rich older households; this will be mitigated by allowing the taxes to be rolled over till the property is disposed of or if the owner (and remaining spouse) dies. It is expected that these measures will produce strong downward pressure on house prices (the annual tax on a £1m house would be £13,000, and £95k on a £5m house and limit their use to store wealth. The yield of the tax, as set out, would be £85bn on static house prices, but I would expect downward pressure on high-cost homes, especially in the southeast, to cause house prices to drop.
Pension: The proposals are to restrict the tax relief to the basic rate of income tax, reducing the subsidy to higher rate taxpayers, to charge a 1% wealth tax on the value of private pensions and the actuarial value of defined-benefit pensions. The current regime disproportionately benefits the already rich, providing generous tax reliefs for payments into a pension scheme and tax-free growth. Ideally, I would like to reduce this for smaller pension pots. However, I did not have the data to analyse this. Such a tax would raise around £58.4 billion a year (without exemptions for small pension pots), roughly three-quarters from private pensions and one-quarter from public sector pension pots. Now the latter are notional rather than actual shoeboxes with cash, so the reduction would be felt as a reduction in the final salary.
Other assets: assets like jewellery, artwork and high-value vehicles should also be taxed at 1% of their value, but I have made no attempt to do this to avoid capturing day-to-day assets like furniture and normal vehicles. The latter are already taxed through VED, which is now levied as a car registration charge linked to emissions, which fulfils ecological tax reform objectives. Similar taxes could be introduced for private jets and yachts to greatly increase the cost of their use in the UK via landing charges and berthing fees. This would require further investigation.
Other matters: UK tax residents should be taxed on their worldwide income. The general idea is that other countries are encouraged to introduce wealth taxes and enter dual-taxation treaties with the UK. This means that individuals will be taxed on their income and wealth in the country where it arises and will only pay the residual tax, netting off the tax paid to the other country.
Ease of intro | Tax rate | Yield (£m) | Source | |
Property tax changes | ||||
Property wealth tax, for properties <£250k | Complex, phased approach | 0.5% | 9,500 | author calculations, based on Halifax quarterly Jan - Mar 2024 house sales |
Property wealth tax, for properties £250k-£500k | Complex, phased approach | 1.0% | 24,900 | author calculations, based on Halifax quarterly Jan - Mar 2024 house sales |
Property wealth tax, for properties £500k–£1m | Complex, phased approach | 1.5% | 25,000 | author calculations, based on Halifax quarterly Jan - Mar 2024 house sales |
Property wealth tax, for properties >£1m | Complex, phased approach | 2.0% | 26,200 | author calculations, based on Halifax quarterly Jan - Mar 2024 house sales |
Withdrawal of Council tax | Easy | (41,200) | from Taxing Wealth Report,2024 | |
Removal of home from IHT | Easy | (3,053) | author calculations from HMRC data on receipts of IHT from deaths in 2022-23 | |
Capital gains on sale of primary residence | Easy | 10,000 | from Taxing Wealth Report,2024 | |
TOTAL | 51,347 | |||
Pension tax changes | ||||
Restricting pension tax relief to basic rate of income tax | Easy | 12000 | from Taxing Wealth Report,2024 | |
1% wealth tax on private pension value | Easy | 42435 | author calculations based on WAS | |
1% tax on public sector pensions | Complex | 16000 | author calculations | |
TOTAL | 58435 | |||
Existing wealth taxes removed | ||||
Stamp duty Land tax | Easy | 0-12% | -13900 | |
Inheritance tax | Easy | -8200 | ||
TOTAL | -22100 | |||
GRAND TOTAL | 87,682 |
[1] The views in the document are the authors’ and do not necessarily represent those of Green House Think Tank or its other staff. Thanks to comments from Oliver Millington, Nadine Storey, Zaid Alasad and Peter Sims
[2] The Green Party of England and Wales’ policy is to introduce a 1% annual wealth tax on assets above £10 million and a 2% tax on assets above £1 billion with a yield of £14bn.
[3] Unplanned gulf between taxation yields and spending
[4] The major official source of information on UK household wealth is ONS’s household-based Wealth and Asset Survey (WAS). The WAS sample consists of 15,100 households undertaken between April 2020 and March 2022. The quality of the statistics has been criticized by the Statistics Commission as unfit to be classified as official statistics, so I have also drawn on HMRC’s inheritance tax data. The WAS has been undertaken ever two years since 2006-2008 but comparison between waves is complicated by changes in methodology.
[5] Institute of Government - https://www.instituteforgovernment.org.uk/explainer/public-sector-pensions)
[6] Drawn from Table 12.1 Inheritance tax numbers and tax due for deaths in 2022-23 https://www.gov.uk/government/statistics/inheritance-tax-liabilities-statistics
[7] Bank of England (2025) https://www.bankofengland.co.uk/statistics/mortgage-lenders-and-administrators/2025/2025-q3
[8] Analysis of ONS online data: “The effects of taxes and benefits on household income, disposable income estimate, UK, 2023/24 - Reference Tables”
[9] https://taxingwealth.uk/wp-content/uploads/2024/04/Taxing-Wealth-Report-2024-Full.pdf
[10] Along with land value tax and consolidated income tax
